The number you are watching does not mean what you think it means
Engagement rate is computed five different ways. And it is collapsing as reach shifts to strangers who will never engage the way a follower does.
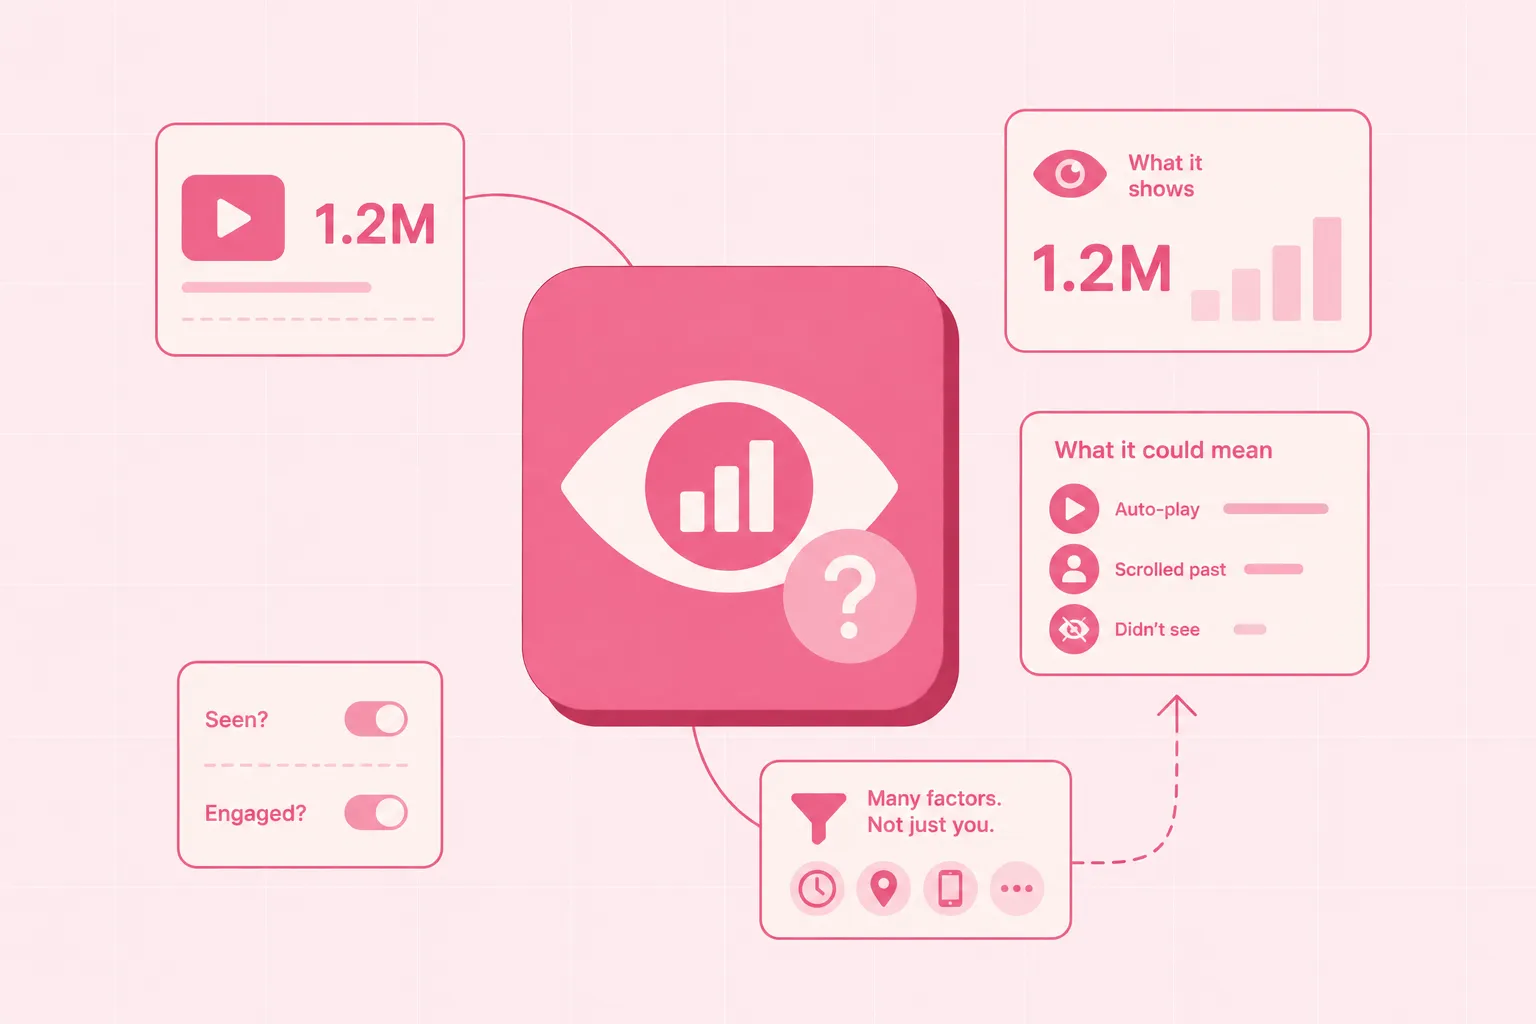
You check your insights. The post did 18,000 accounts reached. Last month the same number would have meant 400 likes. This time it meant 90. You scroll down to engagement rate. It is 0.5%. The one before it was 3.2%. You look at the two posts side by side. You cannot see what changed.
So you go looking. You find a dozen articles. Every one calls it engagement rate. And every one computes it differently. One divides by your followers. One divides by reach. One divides by impressions. A fourth counts only likes and comments. A fifth adds saves and shares. You are watching the same number fall every week. But you do not know which number it is.
Here is what we found. Engagement rate has no official definition. Instagram does not publish a formula for it. The term does not appear in the company's own API documentation for metrics. What everyone calls engagement rate is five different calculations. They use three different denominators. And they can disagree by a factor of ten on the same post. All while your reach is shifting to people who have never heard of you and will not engage the way a follower does.
People read the falling number as a verdict on their content. Usually it is arithmetic. What any single post does is largely out of your hands, which is why nobody can call a hit in advance.
We read Instagram's own API docs. We read what creators are told about reach. We checked the industry calculators. And we looked at what researchers measure when they say engagement rate. Every source below is linked, dated and quoted. One section shows why the number going down may not mean what you think it does.
Instagram does not define engagement rate
Start with what Instagram publishes. The company puts out documentation for developers. People who build software that reads Instagram data. Those docs list every metric the platform measures. If Instagram had an official engagement rate formula, it would be there.
We read the Instagram Graph API reference for account insights, retrieved 18 August 2026. It lists metrics Instagram tracks for your whole account. And the media insights reference, also retrieved 18 August 2026, for individual posts. Between them they define 26 metrics. Likes, comments, shares, saves, reach, impressions. Every raw number you see in your insights.
The phrase "engagement rate" does not appear in either document. Not once.
What does appear is simpler. The API defines an accounts-engaged metric as "the number of accounts that have interacted with your content". Interactions are "actions such as likes, saves, comments, shares or replies". That is from the account insights page. For a single post, the API defines a total-interactions metric as "likes, saves, comments, and shares on the reel, minus the number of unlikes, unsaves, and deleted comments".
Instagram counts the interactions. It does not divide them by anything.
Everyone else divides by something different
The term engagement rate comes from marketers, not from Instagram. And marketers do not agree on what it means.
A web search for "Instagram engagement rate formula" returns ten results on the first page. We checked six of them on 18 August 2026. Every one gives a formula. No two formulas match.
Here is what they divide by.
- Likes plus comments, over followers. Four of the six sources.
- Likes, comments, saves and shares, over followers. Two of the six.
- Total interactions, over reach. Three of the six.
- Total interactions, over impressions. Two of the six.
Those counts add up to more than six because several sources give more than one formula and let you pick. The six are Hootsuite, Later, Sprout Social, GWAA, Stackmatix and HiveHQ, all retrieved 18 August 2026. They disagree on the period too. Some average per post. Some sum over a date range.
Three different denominators. Followers, reach, and impressions. Each one measures something different. And they produce wildly different numbers on the same post.
Take a real example. A post gets 500 likes and 50 comments. 550 interactions total. The account has 20,000 followers. The post reached 8,000 people. It got 15,000 impressions. That one post now has three engagement rates:
- By followers: 550 ÷ 20,000 = 2.75%
- By reach: 550 ÷ 8,000 = 6.88%
- By impressions: 550 ÷ 15,000 = 3.67%
Same post. Three numbers. The biggest is 2.5 times the smallest. And all three get called engagement rate.
The numerator is not settled either. Some count only likes and comments. Some add saves and shares. Instagram's own total-interactions metric subtracts unlikes and deleted comments. Most online calculators do not. So even when two tools use the same denominator, they can disagree on what counts as engagement.
One article we read puts it plainly. From GWAA's engagement rate guide, retrieved 18 August 2026: "What Brands Actually Calculate (and Why Your Number Is Wrong)". The title says it. There is no standard.
What academic researchers use
Researchers who study Instagram have the same problem. And they solve it differently every time.
A 2022 study in the Journal of Marketing looked at how an influencer's follower count affects engagement. The paper is Finding Goldilocks Influencers by Dhanesh Shivakumar and others. It studied 6,422 posts from 1,738 influencers. The data came from five social media agencies. Over 775 million impressions and 49 million likes.
That paper did not use engagement rate at all. It measured absolute numbers. Total likes, total comments, total clicks. Not divided by anything. The authors write nothing about engagement rate formulas. They measure engagement as raw counts.
A 2025 paper in the journal Information did use a rate. Evaluating the Impact of Instagram Engagement Metrics on Corporate Revenue Growth by researchers at universities in Spain and Ecuador. They define engagement as reach, impressions, interaction rate, and virality rate. Four separate things. All called engagement metrics. But they do not publish a single formula called engagement rate.
So even peer-reviewed research does not settle on one calculation. The closest they come is measuring everything and calling it all engagement.
Why the number is collapsing
Here is the mechanism. Instagram now shows your posts to people who do not follow you. A lot of them. And those people engage far less than your followers do.
The reach shift is real and documented
Instagram says this in its own words. From the creators blog on improving reach, retrieved 18 August 2026:
Create engaging content that's original or hasn't been posted on Instagram before.
And this, from the same page:
Check Account Status to see if you're eligible to be recommended to non-followers.
Recommended to non-followers. That is Instagram's own language. Your posts now go to strangers.
The recommendation eligibility page, also retrieved 18 August 2026, names where this happens. Explore, Reels, and Feed suggestions. It describes the signals Instagram uses: "how many times other people like, comment, share or save a post, and how quickly they do so". Then it says this:
Instagram uses multiple signals to personalize recommendations, including the interaction history of the person who posted, and other posts they liked or commented on.
Your post is shown to people based on what they liked before. Not on whether they follow you.
How much reach comes from non-followers? Instagram does not publish that number broken out by account size or content type. But third-party research firms that track Instagram data do. A Sprout Social report from 2025 states: "influencer reach is no longer tied to follower count". Reach now depends on how the content performs with strangers.
Search results from August 2026 reviewing Instagram benchmarks report that Reels deliver 40% to 90% non-follower reach. The exact share depends on account size. Smaller accounts skew toward 40%. Larger accounts see 60% to 90%. Those are ranges from multiple sources including Hootsuite, Cliptics, and Fan Page Karma, all checked 18 August 2026.
Instagram's own system cards confirm the structure behind this. We covered those cards in another post. They describe how posts are gathered, scored, and ranked. The Feed Recommendations card, stamped 29 June 2026, is about posts from accounts you do not follow. It is a whole separate ranking system. For strangers.
Your reach is going to people who have never heard of you. That is not a rumor. It is how the platform now works.
Strangers do not engage like followers do
A follower chose to see your posts. A stranger did not. Instagram's algorithm chose for them. One engaged on purpose. The other is scrolling past recommended content from accounts they never asked for.
That difference shows up in the numbers. Take engagement rate by reach. You divide interactions by the number of people who saw the post. When 5,000 of your 10,000 followers see a post, they engage at one rate. When Instagram adds 15,000 strangers to that audience, your denominator quadruples. But your numerator does not.
Say your 5,000 followers give you 200 interactions. That is 4% by reach. Now Instagram shows the same post to 15,000 strangers. They give you 100 more interactions. Total interactions: 300. Total reach: 20,000. New engagement rate: 1.5%. Your engaged followers did not change. But the rate fell by two thirds.
That is not an invented scenario. That is the arithmetic of what Instagram now does. Your reach grows. Your interactions grow slower. And any rate that divides the second by the first goes down.
Instagram even confirms that non-followers matter more now. From the Feed Recommendations system card, stamped 29 June 2026, describing posts from accounts you do not follow:
Content that the system predicts will provide more value for you is shown higher in your feed.
The system is built to show you posts from strangers. It predicts whether you will find them valuable. And if you do not engage fast, it stops showing them. That is by design.
The same card names what counts as engagement for this system. It lists "How likely you are to click 'Interested'" and "How likely you are to click on the profile of a post's author". Clicking a profile is now an engagement signal. For content from people you do not follow. Because the system is trying to turn a stranger's post into a follow.
If it does not, that stranger just diluted your engagement rate.
What actually goes into "engagement"
Even the numerator is inconsistent. What counts as an interaction? Instagram defines it one way. Tools define it another. And the definition changed in 2024.
Instagram's own definition
The Instagram API lists these as interactions: likes, saves, comments, shares, and replies. That is from the accounts-engaged definition quoted earlier. For a single post, total interactions counts "likes, saves, comments, and shares" and subtracts "unlikes, unsaves, and deleted comments".
Subtracting unlikes is unusual. Most third-party tools never see an unlike. They only see the current like count. So Instagram's official number and the tools' numbers start from different numerators.
What tools count
Most engagement rate calculators online count only likes and comments. A few add saves and shares. Almost none subtract unlikes or deleted comments. We checked six calculators on 18 August 2026. Four count likes plus comments only. Two count all interactions.
Why the split? Likes and comments are public. Anyone can see them. Saves and shares are private. You can only see your own. So third-party tools that do not have API access count what they can scrape. That means likes and comments.
Tools with API access can read saves and shares. But even those do not always include them. Different tools, different formulas. Same name.
The 2024 metric shift
Instagram deprecated one of the core metrics in 2024. From the media insights API documentation, retrieved 18 August 2026:
Deprecated for media created after July 2, 2024.
That is the notice on impressions. The metric everyone used as a denominator until mid-2024 no longer works for new posts. Instagram replaced it with views. Views count "the number of times your content was played or displayed". Same idea, different name.
But that change only hit the API. The Instagram app still shows impressions for older posts. And reach for newer ones. And third-party tools still talk about impressions because that is what they have always called it. So now some tools say impressions, some say views, some say reach, and they are talking about overlapping but not identical things.
One metric. Three names. And the definitions drifted while the old one was being phased out.
The one number Instagram tells creators to watch
Instagram does publish guidance for creators. It does not tell you to watch engagement rate. It tells you to watch reach.
From the tips for improving reach page, retrieved 18 August 2026, the section on monitoring:
Monitor insights to track reach from followers vs. non-followers.
Track reach. Not engagement rate. Instagram's own advice to creators is to measure how many people see the post. And to track where that reach comes from. Followers or strangers.
That page also tells you what to do about eligibility. Check your Account Status to see if you can be recommended to non-followers. If you cannot, Instagram will not show your posts beyond your followers. Your reach stays small. If you can, it shows your posts to strangers. Your reach grows. But your engagement rate, by any denominator, probably falls.
Adam Mosseri said this directly in 2023. From Instagram Ranking Explained, published 31 May 2023:
Instagram doesn't have a singular algorithm that oversees what people do and don't see on the app. We use a variety of algorithms, classifiers, and processes, each with its own purpose.
No single algorithm. Each surface ranks differently. Feed has one set of signals. Explore has another. Reels has a third. And each one blends followers and non-followers differently. So the reach source mix changes by content type. Which means engagement rate by reach changes by content type, even if the engagement rate by followers stays flat.
Instagram does not tell you to optimize for engagement rate. It tells you to make content that gets recommended to non-followers. Those two goals conflict.
When engagement rate is still useful
This does not mean engagement rate is worthless. It means you need to know which one you are measuring and what it tells you.
Engagement rate by followers measures audience health. How much of your follower base still cares. If that number drops, you are losing your core audience. Or Instagram is showing your posts to fewer of them. Both are real problems. This number is stable when calculated the same way over time on the same account. It does not depend on how much non-follower reach Instagram gives you.
Engagement rate by reach measures content performance against the audience that actually saw it. If 10,000 people saw your post and 50 engaged, that is 0.5%. If the next post reaches 10,000 and 500 engage, that is 5%. Same audience size, ten times the engagement. That is a signal. The content landed differently. This number is useful for comparing posts with similar reach. It breaks down when one post reaches your followers and another reaches strangers.
Engagement rate by impressions measures efficiency. How many times did Instagram show your post per interaction? Useful if you are paying for ads. Less useful for organic content where you do not control how many times the platform serves your post.
None of these formulas are wrong. They measure different things. The problem is calling them all the same name and not documenting which one you are tracking.
Pick one. Use it the same way every time. Do not compare your number to someone else's unless you know they computed it the same way. And do not assume a drop means your content got worse. It might mean Instagram is showing it to more strangers. Those are not the same diagnosis.
How to check a number instead of trusting it
One team has already done this the hard way on Instagram. The Markup ran an investigation into Instagram's moderation systems. Published February 2024. They tested whether Instagram suppresses content without telling users. They built 70 test accounts. They posted controlled content. They measured what showed up where.
One finding is useful here. The Markup found that war photos were 8.5 times more likely to be hidden from hashtag pages than other photos. The photos were not graphic. Just tanks, soldiers, buildings. No blood. But 9 of 29 appeared on hashtag pages. While 158 of 172 non-war photos appeared. That is a measurable difference.
The methodology is the lesson. They did not trust the metrics Instagram showed them. They built independent measurements. They checked where posts actually appeared. They documented which counts matched the insights panel and which did not.
That is the move for engagement rate too. Do not trust that the number you see in one tool matches the number you see in another. Test it. Pull the raw numbers. Compute it yourself. Make sure you know what you are measuring before you decide it is falling.
What the published record cannot settle
A claim you will hear everywhere is that early engagement on a post causes more reach. No Instagram document says so. None exists in the sources we read. Meta publishes the signals its models use. It does not publish the weights. The models read interaction counts. How much those counts matter compared to everything else the system tracks is not stated anywhere we could find.
The cold-start research says new posts struggle because they have no interaction history. The randomized experiments say early social proof affects later outcomes. But those studies ran on music downloads, Kickstarter projects, and news sites. Not on Instagram's recommender system. The mechanism is plausible. The size of the effect is unpublished.
What is documented is narrower. Engagement rate is falling for many accounts because reach is shifting to non-followers. If engagement rate by followers is falling too, that is a different problem. That means your core audience is disengaging. Or Instagram is showing your posts to fewer of them.
Separate the two before you conclude anything. Check your insights. Look at reach by follower status. If your follower reach is flat and your non-follower reach is up, your falling engagement rate is arithmetic. Not a verdict on your content.
What we could not verify
Three limits, stated clearly.
We could not open Instagram's Help Center pages directly. Many of Meta's pages are built by code that runs in your browser. A tool that fetches a web page gets an empty shell. We read what could be fetched through web search results and accessible summaries. We did not read the full Help Center articles on insights. So we cannot quote them as primary sources. We say this rather than pretend we read them.
We do not know the exact share of reach that goes to non-followers, broken out by account size, content type, and surface. Instagram does not publish that. The ranges we report come from third-party analytics firms and web search results reviewing 2025-2026 benchmarks. Those sources compile data from their own users. Not from Instagram directly. We cite them with that limit.
We do not know how heavily Instagram's ranking models weight early engagement signals compared to other features. Meta publishes that its models use interaction counts as inputs. It does not publish the weights. Any claim that early engagement increases reach is inference from the signals, not a published finding from Meta. We say that rather than imply Meta confirmed it.
What to watch instead
Your insights panel shows you three numbers that do not lie.
Reach. How many people saw this post. Instagram breaks that number into followers and non-followers. Look at both. If follower reach is dropping while total reach is steady, Instagram is replacing your followers with strangers. That is a real shift. If total reach is dropping, fewer people are seeing your posts at all.
Interactions. The raw count. Likes, comments, saves, shares. Instagram shows you the total. If that number is rising while engagement rate is falling, your denominator is growing faster than your numerator. That is the reach shift at work. If interactions are falling too, your content is landing worse. Or your audience is disengaging. Or Instagram is showing your posts to fewer people who care.
Reach by follower status. This one is new as of 2024. Instagram now splits reach into "followers" and "non-followers" in your insights. The split tells you where your reach is coming from. If 90% is non-followers, you are being recommended hard. If 90% is followers, you are not. Neither is better or worse on its own. They are different games.
Those three numbers tell you what is happening. Engagement rate tells you one number divided by another number, using a formula someone chose and did not document. Watch the raw numbers. You cannot misinterpret them.
One last thing. If someone quotes you an engagement rate benchmark and tells you to hit it, ask them which formula they used. Followers, reach, or impressions in the denominator. Likes and comments only, or all interactions. Per post, or averaged over a period. If they do not know, the benchmark means nothing. It is one number from one formula compared to your number from a different formula. You are not measuring the same thing.
The number you are watching does not mean what you think it means. Now you know why. And you know what to watch instead.
How we did this
We read Instagram's API documentation for developers, published by Meta. We read the creator guidance Instagram publishes on its own site. We checked six engagement rate calculators found via web search on 18 August 2026 to document formula inconsistency. We read two peer-reviewed papers that use engagement metrics, to check how researchers define the term. We reviewed The Markup's investigation into Instagram moderation to understand independent measurement methods. All sources are linked, dated, and quoted above.
We could not open Instagram Help Center pages that are built by client-side code. We report that clearly. We could not find an official Instagram definition of engagement rate in any document we accessed. We also could not find published weights for ranking model features, so we do not claim to know how much early engagement affects reach.
This is a document review. We ran no data collection, no experiment, and no scraping.
Sources
- Instagram Graph API, IG User Insights Reference. Meta for Developers. Retrieved 18 August 2026.
- Instagram Graph API, IG Media Insights Reference. Meta for Developers. Retrieved 18 August 2026.
- How to calculate engagement rate. Hootsuite blog. Retrieved 18 August 2026.
- Instagram engagement rate. Later blog. Retrieved 18 August 2026.
- Instagram Engagement Rate: Formula + Tips (2026). Sprout Social. Retrieved 18 August 2026.
- Instagram Engagement Rate Explained: What Brands Actually Calculate (and Why Your Number Is Wrong). GWAA. Retrieved 18 August 2026.
- How to Calculate Engagement Rate. Stackmatix blog. Retrieved 18 August 2026.
- How to Calculate Engagement Rate on Instagram. HiveHQ blog. Retrieved 18 August 2026.
- Dhanesh Shivarudrappa Shivakumar, Sonja Pferdt Thomaselli, Zoë Junyan Zhu, and V. Kumar, Finding Goldilocks Influencers: How Follower Count Drives Social Media Engagement. Journal of Marketing 87(3), 2022. Sample: 802 campaigns, 1,738 influencers, 6,422 posts. Method: inverted U-shaped regression on absolute engagement counts, not rates. Retrieved 18 August 2026.
- Evaluating the Impact of Instagram Engagement Metrics on Corporate Revenue Growth. Information 16(4):287, 2025. MDPI. Retrieved 18 August 2026.
- Tips for improving your reach. Instagram for Creators. Retrieved 18 August 2026.
- Recommendations on Instagram: What creators need to know. Instagram for Creators. Retrieved 18 August 2026.
- New research finds influencer reach is no longer tied to follower count. Sprout Social press release, 2025. Retrieved 18 August 2026.
- Instagram algorithm tips for 2026. Hootsuite blog. Retrieved 18 August 2026.
- Instagram Algorithm 2026: What Works Now. Cliptics blog. Retrieved 18 August 2026.
- Who Sees Your Content Beyond Your Followers?. Fan Page Karma. Retrieved 18 August 2026.
- Instagram Feed Recommendations AI system card, stamped 29 June 2026. Meta Transparency Center. Content retrieved via web fetch 18 August 2026.
- Adam Mosseri, Instagram Ranking Explained, 31 May 2023. About Instagram. Retrieved 18 August 2026.
- Ariel Wittenberg and Leon Yin, How We Investigated Shadowbanning on Instagram. The Markup, 25 February 2024. Investigation of 70 test accounts. Retrieved 18 August 2026.
Read next
 Evidence & Myths12 min readDo schedulers kill your reach? The post-from-a-real-phone myth, testedThe belief that Instagram punishes scheduled posts is everywhere. Meta runs an official API for exactly that purpose. What the documents actually say, and what nobody can source.
 Evidence & Myths13 min readClose Friends will not grow you, and that is the pointClose Friends is a restriction, not an amplifier. It has real uses for retention and superfans, but reach is not one of them.
 Evidence & Myths17 min readTrending audio on Instagram: the most repeated myth in the creator economyEvery creator is told to chase trending sounds. The Reels system card lists audio signals, but they measure whether you engage with audio, not whether the audio itself is popular.