The experiment that proved hits are partly random
Quality set a floor and a ceiling. Everything in between was luck. Three published experiments on why experts cannot pick the winner, and what that leaves you.
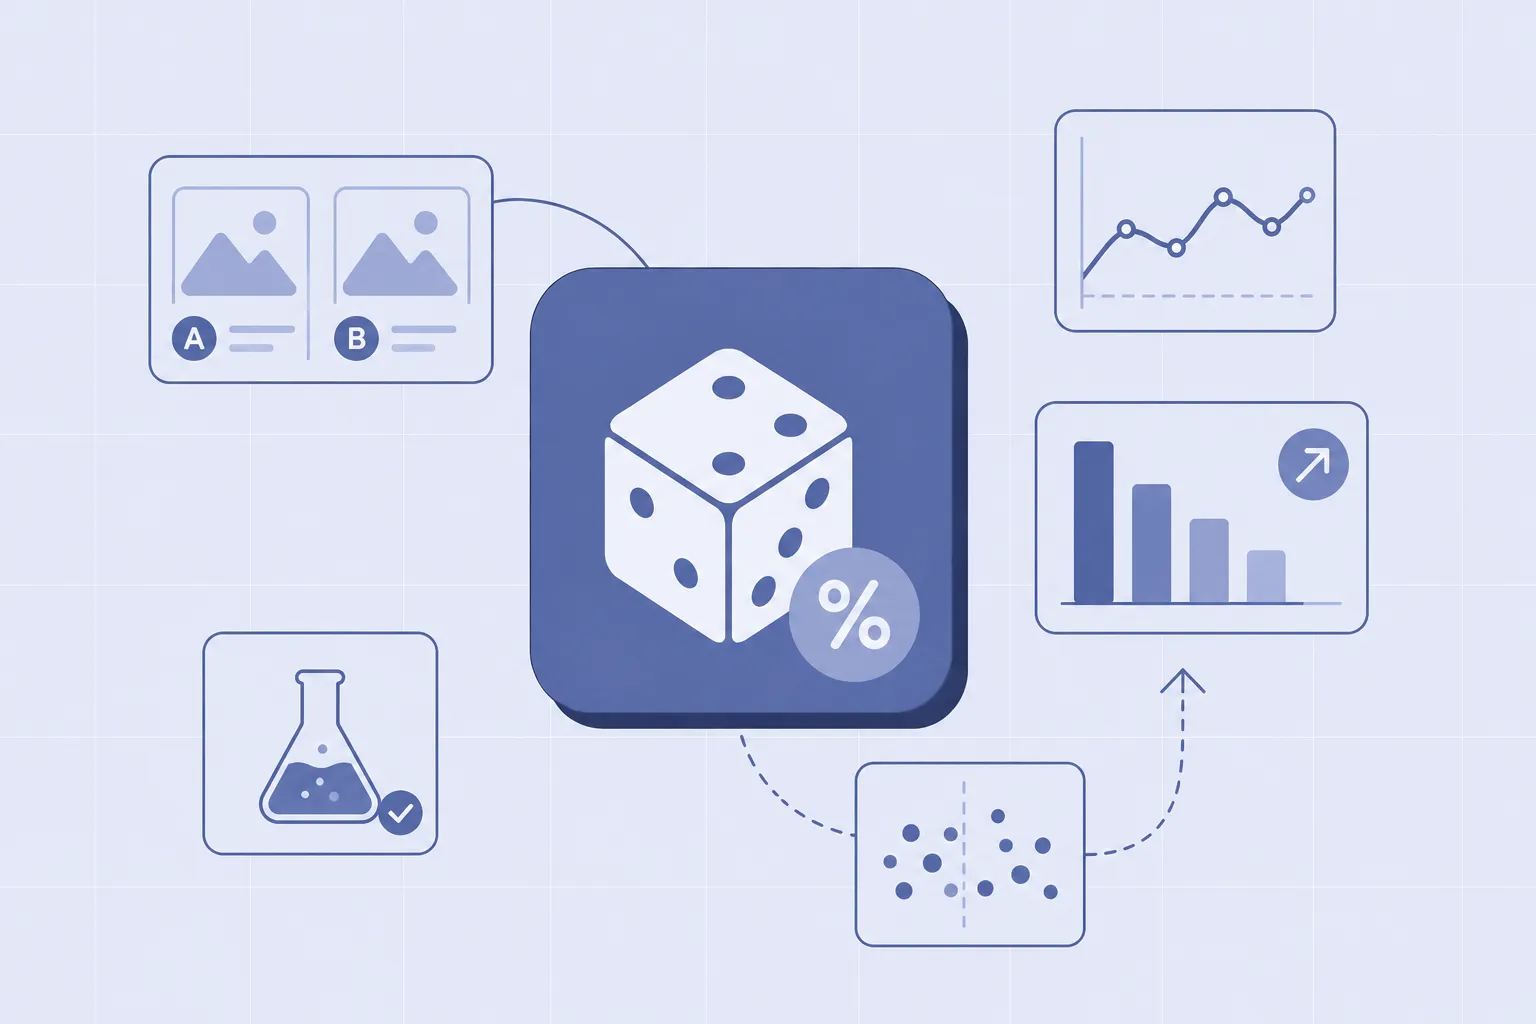
You are looking at two songs. Both are good. You would recommend either one. One gets 200 downloads. The other gets 2,000. You look at the two songs again. You still cannot see what is different.
So you go looking for a reason. Someone will offer one. The second song had better timing. Or a stronger hook. Or it got shared by the right person at the start. That story feels right. It also might be wrong. And the only way to know is to run the whole thing again. With the same two songs. And see if the same one wins.
Three researchers did that. They built eight copies of the same music market. They watched what became a hit in one world and a flop in another. Driven by nothing but which song got an early lead. The best songs rarely did badly. The worst rarely did well. Everything in between was a lottery.
What follows is a reading of three experiments on this question. All three are published. All three ran on real people making real choices. Every source below is linked, dated and quoted.
The broader case that nobody can predict which posts go viral rests on evidence like this. These are the experiments underneath it.
They built eight separate worlds with the same 48 songs
Matthew Salganik, Peter Dodds and Duncan Watts ran the cleanest test of this question that has been published. It appeared in Science on 10 February 2006. They called it an artificial music market. They built it on the web. They recruited 14,341 people. Most came from a teen interest site called Bolt.
The site showed 48 songs. All were by unknown bands. No one had heard them before. Every participant could listen. They rated each song from one star to five. Then they could download it if they wanted to. No one had to.
The researchers split those 14,341 people into two groups. One group saw nothing but the song names and band names. The other group saw one more thing. A download count. How many other people had already downloaded each song.
That second group was split again. Into eight separate worlds. Each world started at zero downloads for every song. A song that got downloaded in world three did not get a count in world four. The two worlds never saw each other. They ran in parallel. Same 48 songs. Eight separate histories.
The design has three things going for it. First, how well a song did in the group that saw no counts gives you a measure of quality. It captures the song itself and what the participants thought of it. Second, you can compare the group that saw counts against the group that did not. That shows what social influence does. Third, you get eight histories to compare. Not one outcome. Eight. For the same set of songs. With the same starting point.
If success is mostly about quality, the eight worlds should agree. If it is partly random, they will not.
The eight worlds did not agree
They did not agree at all. A song that finished in the top five in one world finished in the bottom half in another. The researchers measured this two ways. First, they looked at inequality. How much more popular the most popular songs were than the average. Second, they looked at unpredictability. How much a song's success varied across the eight worlds.
Both went up when people could see the download counts. The worlds with social influence had more inequality than the world without it. The popular songs got more popular. The unpopular songs got less popular. And the eight worlds disagreed with each other more than eight random subgroups of the independent condition did.
The paper states the finding in one sentence:
Increasing the strength of social influence increased both inequality and unpredictability of success. — Salganik, Dodds and Watts, Science, 2006
They ran it twice. The first time, the songs appeared in a grid. The positions were random for each participant. The download counts were there but you had to look for them. The second time, the songs appeared in one column. Sorted by download count. Most popular at the top. The counts were impossible to miss.
The second version made things worse. More inequality. More unpredictability. The stronger the social signal, the more random the outcome.
Quality set a floor and a ceiling, not a rank
The best songs did fine in every world. The worst songs did badly in every world. Everything in between could land anywhere. The researchers put it in the plainest possible sentence:
The best songs rarely did poorly, and the worst rarely did well, but any other result was possible. — Salganik, Dodds and Watts, Science, 2006
Quality set the limits. It did not set the order. A song that finished 10th in one world finished 30th in another. Both outcomes happened to the same song. Heard by similar people. Starting from the same place.
The paper includes a chart of this. It plots each song's quality against its success in each of the eight worlds. Quality is how well it did when people made decisions independently. Success is how well it did in a world where people could see the counts. The best songs never sank to the bottom. The worst never rose to the top. The middle was all over the place.
This is the result to carry. An expert can tell you which songs will do well and which will do badly. They cannot tell you which one will be the hit. Not because they are bad at their job. Because the question has no answer.
They inverted the rankings to see if popularity causes more popularity
Salganik and Watts ran a follow-up. It appeared in 2008. They took one of those social influence worlds. They let it run until the rankings settled. Then they flipped the order. The song with the most downloads became the song with the fewest. The song with the fewest became the song with the most. Second-most swapped with second-least. All the way down.
Then they kept the experiment running. With the inverted counts. They recruited 12,207 new participants. They watched what happened.
If popularity is just a signal of quality, the rankings should snap back. The good songs should recover. The bad songs should sink. If popularity causes more popularity, the inverted rankings should stick.
Neither thing happened cleanly. The very best songs did recover. Their success was not affected by the manipulation. The worst songs stayed at the bottom even after being promoted. But the middle songs stayed where the researchers put them. A mediocre song that got artificially boosted kept that boost. A decent song that got artificially demoted stayed down.
The paper describes this as a self-fulfilling prophecy. At the individual song level, most songs that were promoted did better. Most songs that were demoted did worse. The fake lead became a real one.
The correlation is the proof. In the worlds that were not manipulated, the correlation between early rankings and final rankings was 0.84. Strong. In the inverted worlds, that correlation dropped to 0.16. Weak. The manipulation worked. It changed the outcome.
The findings and all the numbers above come from the paper itself. It is titled "Leading the Herd Astray: An Experimental Study of Self-fulfilling Prophecies in an Artificial Cultural Market". It appeared in Social Psychology Quarterly in 2008. The full text is available at the National Library of Medicine, PMC3785310. We read it on 18 August 2026.
The authors stated their own limits. The inversion was total. Real markets involve subtler manipulation. Participants saw only download counts. Real markets have richer information. There were only 48 songs. Real markets have thousands of products. And the experiment excluded the actors who shape real markets. Music executives. Radio stations. Critics. The results are suggestive. They are not conclusive. That is their own wording.
This is not about Instagram
None of the three experiments we read ran on Instagram. None ran on any platform that recommends things. They ran on song downloads, news site ratings, crowdfunding, and review endorsements. Every one of them showed visible tallies to the next person. So one person's choice reached the next person directly. Through a number they could read.
Instagram does not work that way. You cannot see how many people watched a post before you did. The count goes to the models. Not to you. It gets fed in as a signal. Weighted in ways Meta does not publish.
No published experiment we could find shows that early engagement causes more reach inside Instagram's own ranking software. Not a weak one. None.
Two things follow from that gap. They point opposite ways. That is the honest state of the question. On one side, the mechanism is plausible. Instagram's models can read what people did with a post. A post with some history beats a post with none. A new post starts with nothing. So giving it something early should help. Meta's own engineers have called interaction features "usually the most powerful" facts the models have. That comes from their 9 August 2023 post on scaling Explore. We read it on 18 August 2026. That line is our reading of their documents. It is not a published finding about the size of any effect.
On the other side, the size of any such effect is unpublished. Its shape over time is unpublished. And the one random result that speaks to size at all found the returns flattening. Not compounding.
The 2014 paper is the one to read on that. Van de Rijt, Kang, Restivo and Patil ran the version that is hardest to argue with. They handed out success at random. To real people. On four live websites. Then they watched. They donated to unfunded Kickstarter projects. They gave Wikipedia editors an award. They signed young change.org petitions. They rated Epinions reviews as very helpful. All at random.
Every site moved the same way. Take Kickstarter. Of the projects left alone, 39% went on to attract more funding. Of the ones given a single donation by the researchers, 70% did. The gap was statistically significant. A fluke that big is unlikely. The test statistic was chi-squared equals 19.4, P equals 0.000. The other three sites moved in the same direction. All four gaps were significant.
Then comes the sentence this section exists for. Their finding, in their words:
success exhibited decreasing marginal returns, with larger initial advantages failing to produce much further differentiation. — van de Rijt, Kang, Restivo and Patil, PNAS, 2014
More is not proportionally better. They put the shape of it in one line:
The per-donor effect of a single donation by a single donor on fundraising success was greater than that of four donations by four separate donors. — van de Rijt, Kang, Restivo and Patil, PNAS, 2014
One donor helped more than four. Per donor. That is the opposite of compounding.
The paper appeared in PNAS on 13 May 2014. It is titled "Field experiments of success-breeds-success dynamics". The full text is open at PubMed Central, PMC4024896. We read it on 18 August 2026. The round-one sample sizes were 200 Kickstarter projects, 305 Epinions reviews, 521 Wikipedia editors and 200 change.org campaigns. A second round ran on Kickstarter and Epinions only. Wikipedia and change.org had one round each.
The direction has a documented reason. A post with history has something to show the models. A post without history does not. The size has nothing behind it. So someone quotes you a multiplier for early engagement. They are quoting an experiment that does not exist. Ask them for it.
The experiment says nothing about timing or hashtags
Salganik's eight worlds tested one thing. Whether early social influence makes success more random. It did. That finding does not carry over to timing. Or to hashtags. Or to captions. Or to thumbnail choice. None of those were tested.
The experiment also says nothing about platforms that hide the tallies. Instagram does not show you how many people watched a reel before you did. TikTok does not show you how many people scrolled past. The cause in Salganik's experiment ran person to person. Because each person could read the count. That path does not exist on Instagram. Not in the same form.
What the experiment does show is that even when quality is real and measurable, success in the middle of the pack is random. Experts can rule out the worst. They can spot the best. They cannot pick the winner from the middle. Not because they are incompetent. Because the process is random.
What we could not determine
Four things, named so no one assumes we checked and stayed quiet.
Where the eight-worlds design originated. Salganik, Dodds and Watts published it in 2006. They cite earlier theoretical models. They do not cite an earlier experiment with parallel independent histories. We could not determine whether they invented the method or adapted it from unpublished work. The 2006 paper is the earliest published use of it we could find.
Any published replication on Instagram or TikTok. We searched for experiments testing whether early engagement causes more reach on Instagram's ranking software. We found none. Not on Instagram. Not on TikTok. Not on YouTube Shorts. The best evidence is on platforms where the counts were visible. Not on recommendation engines.
The exact sample size for the Muchnik 2013 study. Muchnik, Aral and Taylor published "Social influence bias: a randomized experiment" in Science in 2013. It tested fake upvotes and downvotes on a social news site. The abstract is free. It gives no sample size. The full text sits behind a paywall. Science refuses automated retrieval. One of the authors hosts a pre-publication supplement openly. It carries counts. It is also stamped "not for citation". So we do not report its numbers as the paper's. The abstract is at PubMed, 23929980. We read it on 18 August 2026. We could not read the full paper.
Whether the same result holds for Instagram Reels versus photos. The experiments above ran on music downloads and crowdfunding. Instagram has multiple surfaces. Feed. Reels. Explore. Each has its own ranking model. Each has its own signals. We do not know whether early engagement matters equally across all of them. Meta has not published that. No independent experiment has tested it.
How we did this
Scope: this post reads published experiments and summarizes their findings. No data collection. No experiment of our own.
How we read them: the Salganik 2006 paper was retrieved as a PDF on 18 August 2026. We read all ten pages. The van de Rijt 2014 paper was read as HTML at PubMed Central on 18 August 2026. The Salganik and Watts 2008 paper was read as HTML at PubMed Central on 18 August 2026. Every quoted sentence was copied directly from the source. No character is altered except for rendering straight quotes in place of curly ones for consistency.
Limits: three of the sources are more than ten years old. The Salganik 2006 paper is eighteen years old. Instagram did not exist when it was published. The findings are about social influence in markets where tallies were visible. Instagram is not that. The mechanism is plausible. The evidence is indirect.
Sources
- Matthew J. Salganik, Peter Sheridan Dodds and Duncan J. Watts, Experimental Study of Inequality and Unpredictability in an Artificial Cultural Market. Science 311(5762):854-856, 10 February 2006, doi:10.1126/science.1121066. Randomized experiment, 14,341 participants, 48 songs, eight independent social-influence worlds plus one independent condition. Method: web-based music downloads with or without visible download counts. Inequality measured by Gini coefficient. Unpredictability measured by average difference in market share across worlds. Full text read as PDF. Retrieved 18 August 2026.
- Matthew J. Salganik and Duncan J. Watts, Leading the Herd Astray: An Experimental Study of Self-fulfilling Prophecies in an Artificial Cultural Market. Social Psychology Quarterly 71(4):338-355, 2008, doi:10.1177/019027250807100404. Follow-up experiment, 12,207 participants after initial setup phase of 2,211. Method: inverted popularity rankings in two new social-influence worlds, tracked against two control worlds. Key finding: correlation between projected and actual final rankings dropped from 0.84 in unchanged worlds to 0.16 in inverted worlds. Full text read at PubMed Central. Retrieved 18 August 2026.
- Arnout van de Rijt, Soong Moon Kang, Michael Restivo and Akshay Patil, Field experiments of success-breeds-success dynamics. PNAS 111(19):6934-6939, 13 May 2014, doi:10.1073/pnas.1316836111. Randomized field experiments across four live platforms: Kickstarter (200 projects round one, 293 total), Epinions (305 reviews round one, 481 total), Wikipedia (521 editors, one round), change.org (200 campaigns, one round). Treatment: one donation, one award, twelve signatures, or one "very helpful" rating, assigned at random. Kickstarter result: 39% of control projects attracted more funding, 70% of treated projects did, chi-squared 19.4, P less than 0.001. Full text read at PubMed Central. Retrieved 18 August 2026.
- Vladislav Vorotilov and Ilnur Shugaepov, Scaling the Instagram Explore recommendations system, 9 August 2023. Engineering at Meta. Source of the sentence about user-item interaction features being "usually the most powerful" facts the models have, stated in the context of why the retrieval stage cannot use them. Retrieved 18 August 2026.
- Lev Muchnik, Sinan Aral and Sean J. Taylor, Social influence bias: a randomized experiment. Science 341(6146):647-651, 9 August 2013, doi:10.1126/science.1240466. Randomized experiment on a social news website testing fake upvotes and downvotes. We could not read the full text. It sits behind a paywall and the publisher refuses automated retrieval. Abstract read at PubMed. Retrieved 18 August 2026.
Changelog
- 2026-08-18: First version drafted.
Read next
 Evidence & Myths11 min readWho engages matters more than how manyA study of 54 million invitations found that five signals from five separate corners of your life beat five from one clique. The catch: it measured website sign-ups, not Instagram reach.
 Evidence & Myths9 min readA 61-million-person experiment on whether social proof changes behaviorOne experiment on 61 million people found that seeing which specific friends had already acted made people act too. A counter on its own did nothing. The hardest evidence we have that real social proof moves behavior.
 Evidence & Myths12 min readWhat your brain does when it sees a like — the fMRI evidenceResearchers put people in a scanner and showed them their own posts with likes on them. The reward system lit up. And people copied what was already popular.