The half-life of a post: how long your content actually keeps working
A tweet's working life is measured in minutes. A Pinterest pin's in months. What the platforms actually document about how long a post keeps reaching people, and what they stay silent on.
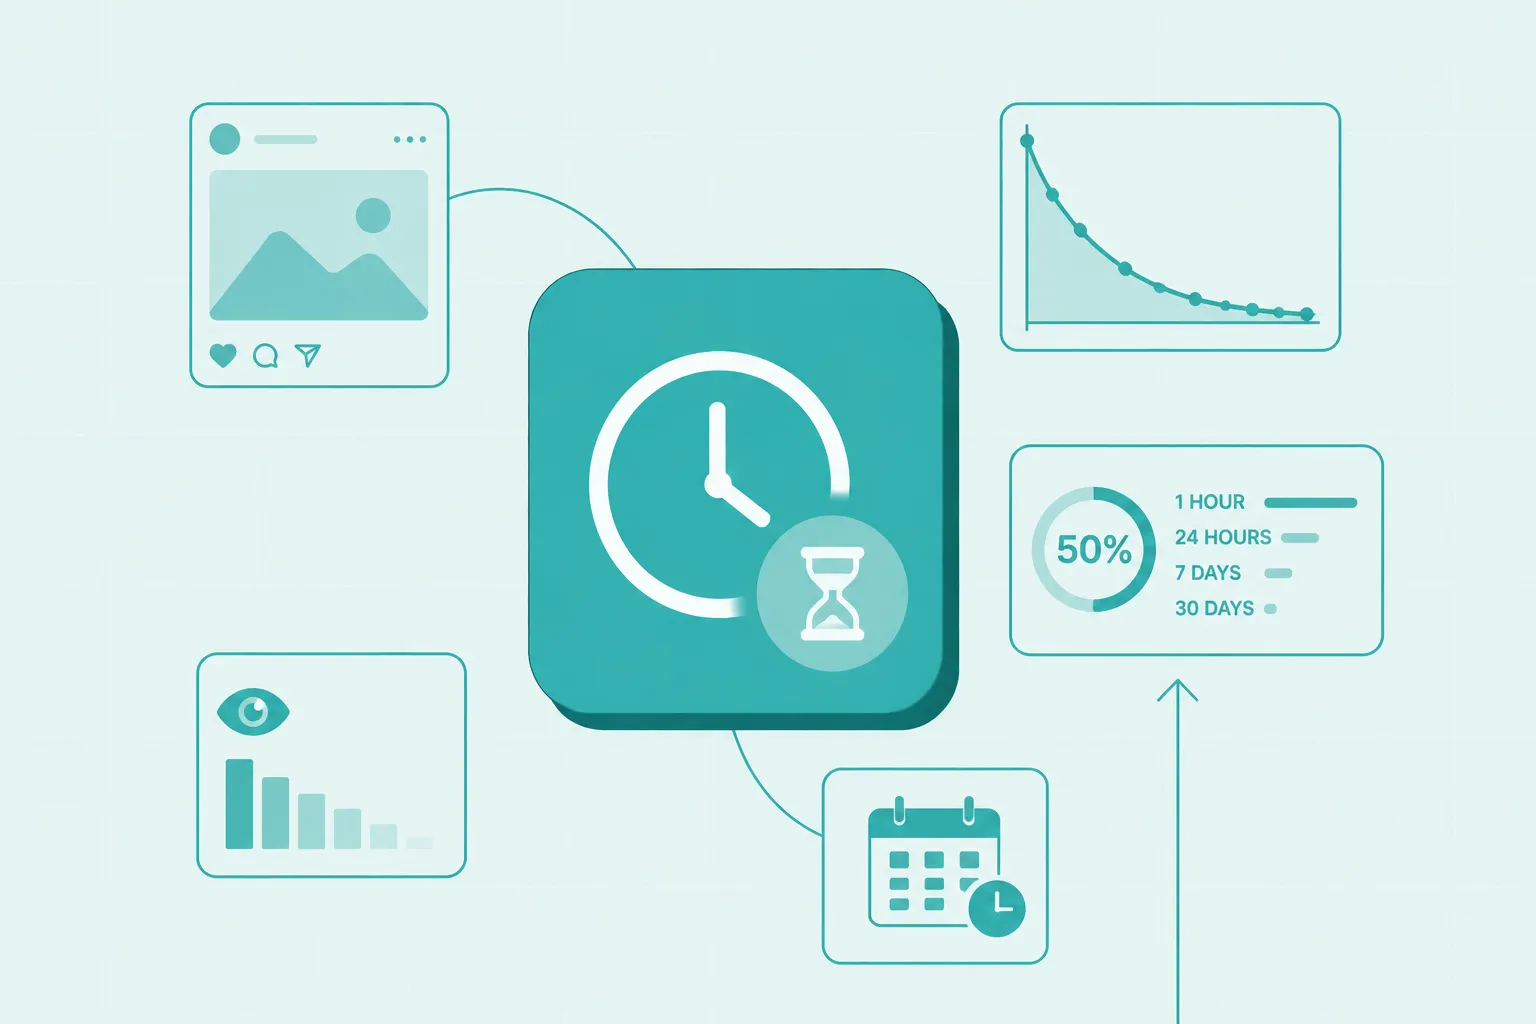
You posted yesterday at 2pm. You check the views this morning. Still climbing. You posted the same thing on a different app last week. Dead in four hours.
So you go looking for an answer. How long does a post actually work? Not how long it sits on your profile. How long the platform keeps showing it to people. One app might give your work an hour. Another might give it months. That should change where you put your effort.
Here is what we found. Most platforms publish nothing. One number exists. Instagram's Feed ranking page names "within 90 days" as a signal. That is it. That is the only explicit time window any Meta platform gives. The rest stay silent. No documented curve. No stated half-life. Not for Reels, not for Stories, not for anything else.
What exists instead is research. People outside the companies measured how long posts get seen. The numbers are real. But they come from studies, not from official pages. And the numbers move. The same platform can cut a post's working life in half and never announce it.
Every source below is linked, dated and quoted. Where a number comes from a company's own marketing rather than a measurement, we say so.
This post is about the far end of a post's life. The near end is a separate problem. In the first minutes Instagram ranks a new post as a cold item, with no history to read at all.
Most platforms tell you nothing about how long your work lasts
Start with what is actually documented. We read the system cards for Instagram Feed, Reels, Explore and Stories. We read TikTok's recommendation transparency page. We read YouTube's help pages on recommendations. We looked for any statement about how long content stays in the pool. How many days. How many hours. Any window at all.
Instagram Feed gives one. The system card lists "How recently the post was created (within 90 days)" as a signal. Ninety days. That signal feeds the guess about whether you will share the post with someone. It is the only published time window Meta gives for any Instagram surface across all the documents we read.
The Reels card describes the ranking model. It names the signals. It explains the predictions. It gives no time limit. Same for Explore. Same for Stories. Those pages describe what the software does. They do not say how long a post stays eligible.
TikTok's newsroom post on recommendations names one time-based rule. It says "videos that have just been uploaded or are under review" may not reach the For You feed yet. That is a floor, not a ceiling. It says nothing about how long a video keeps circulating once it is approved.
YouTube's help page on recommendations names the signals. Watch history. Search history. Likes and subscriptions. It describes no preference for new content over old. But it also makes no claim about long-tail traffic. The word "evergreen" does not appear on that page. Neither does any statement about older videos continuing to get views.
That is what the platforms document. One 90-day signal on Instagram Feed. Nothing else. No decay curve. No half-life. No published mechanics for how long your work keeps running.
What research outside the platforms shows
The numbers that do exist come from people who measured it themselves. Not from the companies.
Scott M. Graffius published research on social media post half-life in the peer-reviewed journal Res Rhetorica in 2024. A half-life is the time it takes for a post to reach half of the total engagement it will ever get. He analyzed eight platforms using data from multiple sources. His stated reason: "reports by others on the shelf life of social media are often outdated or based on the experience of one person, one organization, or one limited set of data."
His July 2022 analysis drew from 25 sources. Here are his numbers:
- Twitter: 23 minutes
- Facebook: 60 minutes
- Instagram: 1,170 minutes, which is 19.5 hours
- LinkedIn: 1,440 minutes, which is 24 hours
- YouTube: 8,640 minutes, which is 6 days
- Pinterest: 164,270 minutes, which is 3.75 months
- Snapchat: 0 minutes, because messages can disappear instantly
- Blogs: 1,051,200 minutes, which is 2 years
Those numbers moved between his January 2022 and July 2022 reports. Twitter dropped one minute. Facebook gained ten. Instagram gained thirty. The platforms can change how long they show your work. They do not have to tell you.
A second study measured Twitter alone. Juergen Pfeffer, Daniel Matter and Anahit Sargsyan analyzed impression counts using Twitter's API. They measured impressions repeatedly over time. Their paper, submitted to arXiv in February 2023, found "the median half-life of a Tweet...is about 80 minutes." The peak comes earlier. At 72 seconds. And "after 24 hours, no relevant number of impressions can be observed for ~95% of all Tweets."
That is an arXiv preprint. It is not peer-reviewed. The abstract calls it a "preliminary analysis." It states no sample size. We report it because it is the only study we found that measured impressions directly from a platform's own API. And because its 80-minute finding sits close to Graffius's 23-minute number. Both say the same thing. A tweet's working life is measured in minutes.
Facebook research points the same way. Multiple studies found that Facebook posts get about half their engagement in the first two to four hours. One study analyzing 100 participants found posts are "typically short-lived", with engagement concentrated in the early hours. It also found that post lifespan was significantly longer for users over fifty than for those eighteen to thirty.
LinkedIn sits in between. Research suggests LinkedIn posts have a half-life of 11 to 15 hours. Some claim up to 24 hours for certain content types. But the critical window is shorter. Multiple sources say the first 60 to 90 minutes after publishing predict whether a post gains traction. Posts that do not get engagement velocity early stop reaching new people.
Pinterest is the outlier, and its claims are its own
Pinterest is different from everything above. Its business blog makes that case directly:
Your content will keep appearing for relevant audiences over time, long after the day you post it.
And:
Because content is evergreen, your hard work works harder, and people will keep seeing your ideas over time.
The same page says "content is displayed based on engagement signals and topics, rather than ranked chronologically." That is a structural claim. Pinterest is not a feed. It is a search engine for images. So a pin does not get buried by newer posts the way a tweet does.
Graffius's research backs the direction. His 3.75-month half-life for Pinterest is about 7,100 times longer than Twitter's 23 minutes. That gap is real.
But every claim above comes from Pinterest's own marketing. Not from an independent study. Not from a peer-reviewed paper. Not even from a disclosed method. Pinterest says its content is evergreen. We have no measurement to check that against. So we report it as Pinterest's claim, not as a finding.
YouTube's long tail is real but undocumented
YouTube is described everywhere as having long-tail traffic. Creators report that videos from years ago still get views. Multiple articles say "evergreen" YouTube content can drive traffic for months or years through search and recommendations.
We went looking for where YouTube says that. We could not find it. YouTube's official blog post on recommendations explains how the system works. It describes signals. It explains personalization. It says nothing about whether older videos keep getting recommended. The word "evergreen" does not appear.
YouTube's help page on the Reach tab describes analytics. Traffic sources. Impressions. Click-through rates. It gives no statement about content longevity.
What exists is creator experience. A video from five years ago that still brings traffic. A tutorial that ranks in search long after upload. Those are real. But YouTube has not documented the mechanism in the pages we read. It has not published a curve. It has not said "videos remain eligible for recommendations for X months."
The structure suggests it. YouTube is a search engine. Search engines surface the best answer to a query. Upload date is not the best answer. Relevance is. So an older video that answers a question can outrank a newer one that does not. That is the theory. YouTube has not confirmed it in writing.
Instagram Reels can resurface for weeks
Instagram Reels do not fit the "dead in 24 hours" pattern that Feed posts follow. Multiple sources say Reels can keep gaining views for one to six weeks after posting. One source says a three-week-old spike in views is normal. The algorithm can resurface a Reel when it finds a new group of people who might watch it.
That claim appears across creator-focused blogs. We found no Meta document that states it. The Reels system card describes how Reels are ranked. It does not describe how long they stay in the pool.
What the card does show is that Reels ranking leans on engagement signals. How many people watched at least three seconds. How many skipped within two seconds. How much time users spent watching. Those are all facts that build over time. A Reel posted yesterday has few of them. A Reel posted two weeks ago has more. So the ranking model can score an older Reel more confidently than a brand-new one.
That is our reading. It is not a published finding.
What this means for where you put your effort
Here is the trade. A tweet gets 23 minutes. A YouTube video gets six days, maybe years. A Pinterest pin gets months. That should matter for where you invest your time.
A piece of work that keeps running for months can be worth more than ten pieces that die in an hour. Even if each one takes the same time to make. That is true if the monthly traffic from the long-running piece beats the day-one spike from the ten short ones. And if you count the cumulative value, not just the peak.
But we cannot prove that trade works for you. We have no study showing that an hour spent on YouTube beats an hour spent on Twitter for a given creator in a given niche. The half-life numbers are real. The return-on-effort claim is logic, not measurement.
The strongest inference runs the other way. If a platform gives your work ten minutes, you cannot afford to spend ten hours on one post. The math does not close. A platform that kills posts in an hour forces you toward volume. A platform that runs posts for months lets you build a library.
What we could not determine
Five things we looked for and could not verify.
Any official half-life from Meta, TikTok, or YouTube. The 90-day signal on Instagram Feed is the only explicit time window we found. Every other number in this post comes from research outside the companies. Not from the platforms themselves.
Whether Instagram's 90-day window applies to Reels. The Feed card names it. The Reels card does not. We do not know if the same signal applies to Reels or if Reels have a different window.
How Graffius derived his Instagram number. His paper says it draws from multiple sources. It does not name them. We report his 19.5-hour finding because it appeared in a peer-reviewed journal. We cannot check his method.
YouTube's long-tail mechanism. Creators report it. Articles describe it. We could not find YouTube stating it in their own documentation. So we say it is observed, not documented.
Pinterest's actual half-life from an independent measurement. Graffius gives 3.75 months. Pinterest says content is evergreen. We have no independent study with a disclosed method that measured Pinterest and reported a sample size. So the direction is supported. The exact number is not.
How we did this
We read system cards for Instagram Feed, Reels, Explore, and Stories on 17 August 2026. We read TikTok's recommendation transparency page. We read YouTube's help pages on recommendations and reach. We read the Pfeffer study from arXiv. We read Graffius's July 2022 update and the page describing his Res Rhetorica publication. We read the Pinterest business blog. Every quotation was copied as the page rendered it.
Limits: most claims about content longevity come from outside research, not from the platforms. Graffius's work is peer-reviewed but does not disclose his data sources. The Pfeffer study is a preprint and states no sample size. Pinterest's evergreen claims are first-party marketing. YouTube's long-tail traffic is described everywhere but documented nowhere in the official pages we read. Any correction is recorded in the changelog at the end of this post, with the date we caught it.
Sources
- Instagram Feed AI system card, stamped UPDATED JUN 29, 2026. Meta Transparency Center. Retrieved 17 August 2026.
- Instagram Reels Chaining AI system card, stamped UPDATED NOV 11, 2025. Meta Transparency Center. Retrieved 17 August 2026.
- Instagram Explore AI system card, stamped UPDATED JUN 22, 2026. Meta Transparency Center. Retrieved 17 August 2026.
- Instagram Stories AI system card, stamped UPDATED JUN 29, 2026. Meta Transparency Center. Retrieved 17 August 2026.
- How TikTok recommends videos #ForYou, TikTok Newsroom, undated. Retrieved 17 August 2026.
- How YouTube recommendations work, YouTube Help Center, undated. Retrieved 17 August 2026.
- Reach metrics in YouTube Analytics, YouTube Help Center, undated. Retrieved 17 August 2026.
- Scott M. Graffius, Lifespan (Half-Life) of Social Media Posts, featured in Landowska, A., Rocci, A., & Koszowy, M. (2024, April 3). Contemporary Prolepsis in Digital Rhetoric: The Roles and Functions of Proleptic Cues. Res Rhetorica, 11(1): 138-154. DOI: https://doi.org/10.29107/rr2024.1.10. Data from July 2022 update, analyzed from 25 sources. Retrieved 17 August 2026.
- Juergen Pfeffer, Daniel Matter and Anahit Sargsyan, The Half-Life of a Tweet, arXiv:2302.09654v2, submitted 19 February 2023, revised 11 April 2023. arXiv preprint, not peer-reviewed. Method: repeated measurement of Twitter impression_count variable via Twitter API. Sample size not stated in abstract. Retrieved 17 August 2026.
- The Life Span of a Facebook Post: Age, Gender Effects, ResearchGate. Study of 100 participants. Retrieved 17 August 2026.
- Beginner's Content Guide, Pinterest for Business, undated. First-party marketing material. Retrieved 17 August 2026.
- On YouTube's recommendation system, YouTube Official Blog, undated. Retrieved 17 August 2026.
Changelog
- 2026-08-18: First version drafted.
Read next
 Distribution21 min readStories is not Feed, and almost nobody researches itEvery guide is about Reels and Feed. Stories runs on a different system with different signals, and it is the one surface built to reach people who already follow you.
 Distribution13 min readThe minus sign — what Instagram scores against youMeta's 2023 engineering post prints the scoring formula. The "see less" term is subtracted. Every system card lists predictions nobody talks about.
 Distribution20 min readWhere a clip travels furthest: Shorts vs Reels vs TikTokThe same 30-second clip meets three different engines. One ignores your follower count, one ranks by it, and one publishes almost nothing. A comparison built only from what the platforms themselves publish.